Is my child growing well?
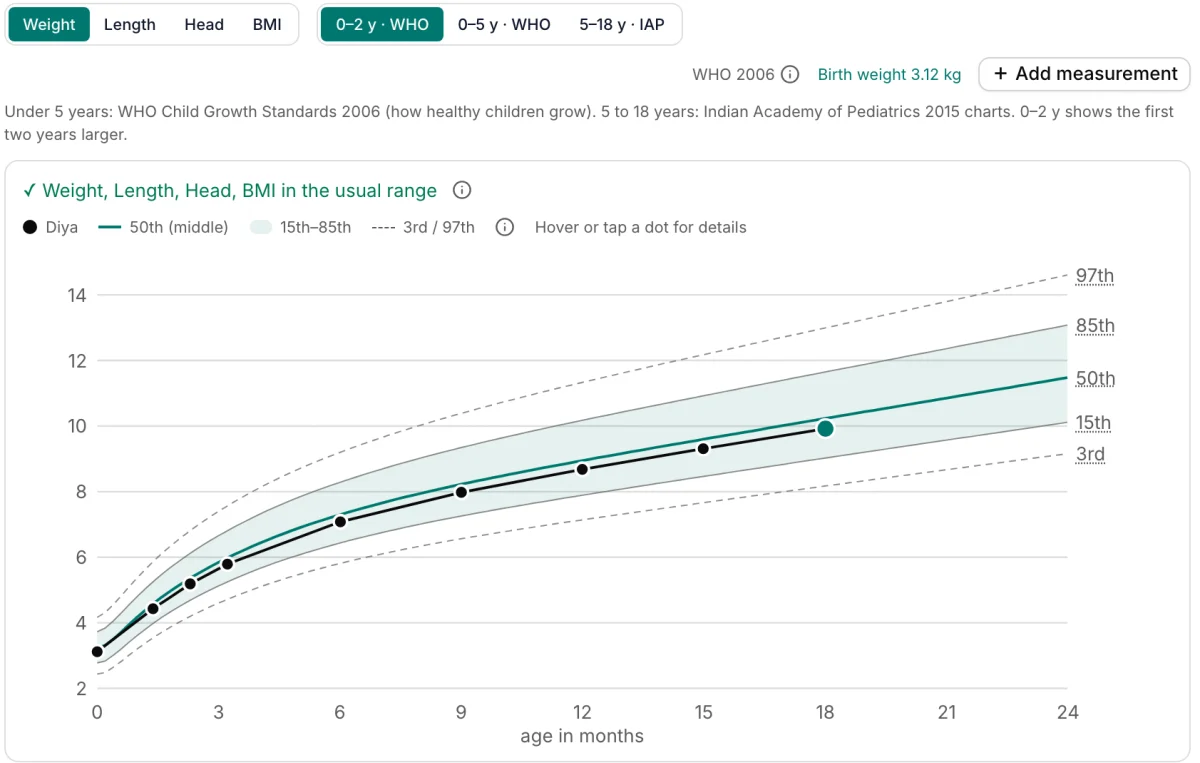
See where a child's weight and height sit among healthy children of the same age and sex, on the WHO growth charts used worldwide and the IAP charts for older Indian children.
What a percentile means
The 40th percentile means that of 100 healthy children of the same age and sex, 40 weigh less and 60 weigh more. Anywhere between the 3rd and the 97th is in the usual range.
A single reading matters less than the line it follows. A child who keeps growing along the same curve is usually growing well, whether that curve is the 15th or the 85th.
Which chart is used
Birth to 5 years: the WHO Child Growth Standards (2006), built from healthy breastfed children in six countries, including India. From 5 to 18 years: the Indian Academy of Pediatrics charts (2015).
For babies born before 37 weeks, the age is corrected for prematurity until 2 years, as paediatricians do.
What the percentile lines mean
| Line | z-score | Meaning |
|---|---|---|
| 3rd | −1.88 | 3 in 100 healthy children are below it: the lower edge of the usual range |
| 15th | −1.04 | On the smaller side, but in the usual range |
| 50th | 0 | The middle: half are above, half below |
| 85th | +1.04 | On the bigger side, but in the usual range |
| 97th | +1.88 | 3 in 100 are above it: the upper edge of the usual range |
Common questions
My child is on the 10th percentile. Is that a problem?
Not on its own. The 10th percentile is in the usual range. What matters is whether the child keeps to their curve; crossing two lines downwards, or being below the 3rd, is worth showing to your doctor.
Why does the chart change at 5 years?
WHO's growth standards end at 5 years. After that this tool uses the Indian Academy of Pediatrics charts, which describe healthy Indian children up to 18 years.
Is my child's information saved?
No. Everything is worked out on your phone; nothing you type is sent anywhere.
Reviewed by Dr. Herin Shah, MBBS on . For information; it does not replace a doctor's advice.
Sources
- WHO Child Growth Standards (2006)
- IAP growth charts for 5 to 18 years, Indian Pediatrics 2015;52:47
For doctors
Doccine does this for every patient in your clinic.
Doccine plots every child's weight, height and head size on these charts at each visit, with the percentile next to the value and corrected age for babies born early.